Overview
Cloudmon Probe monitors IP network endpoints, and devices in the network like routers, switches, servers and hosts supporting SNMP and periodically pushes the metrics to Cloudmon controller.
It collects network statistics of endpoints, such as Jitter, Latency, loss and also traces the path to the endpoint.
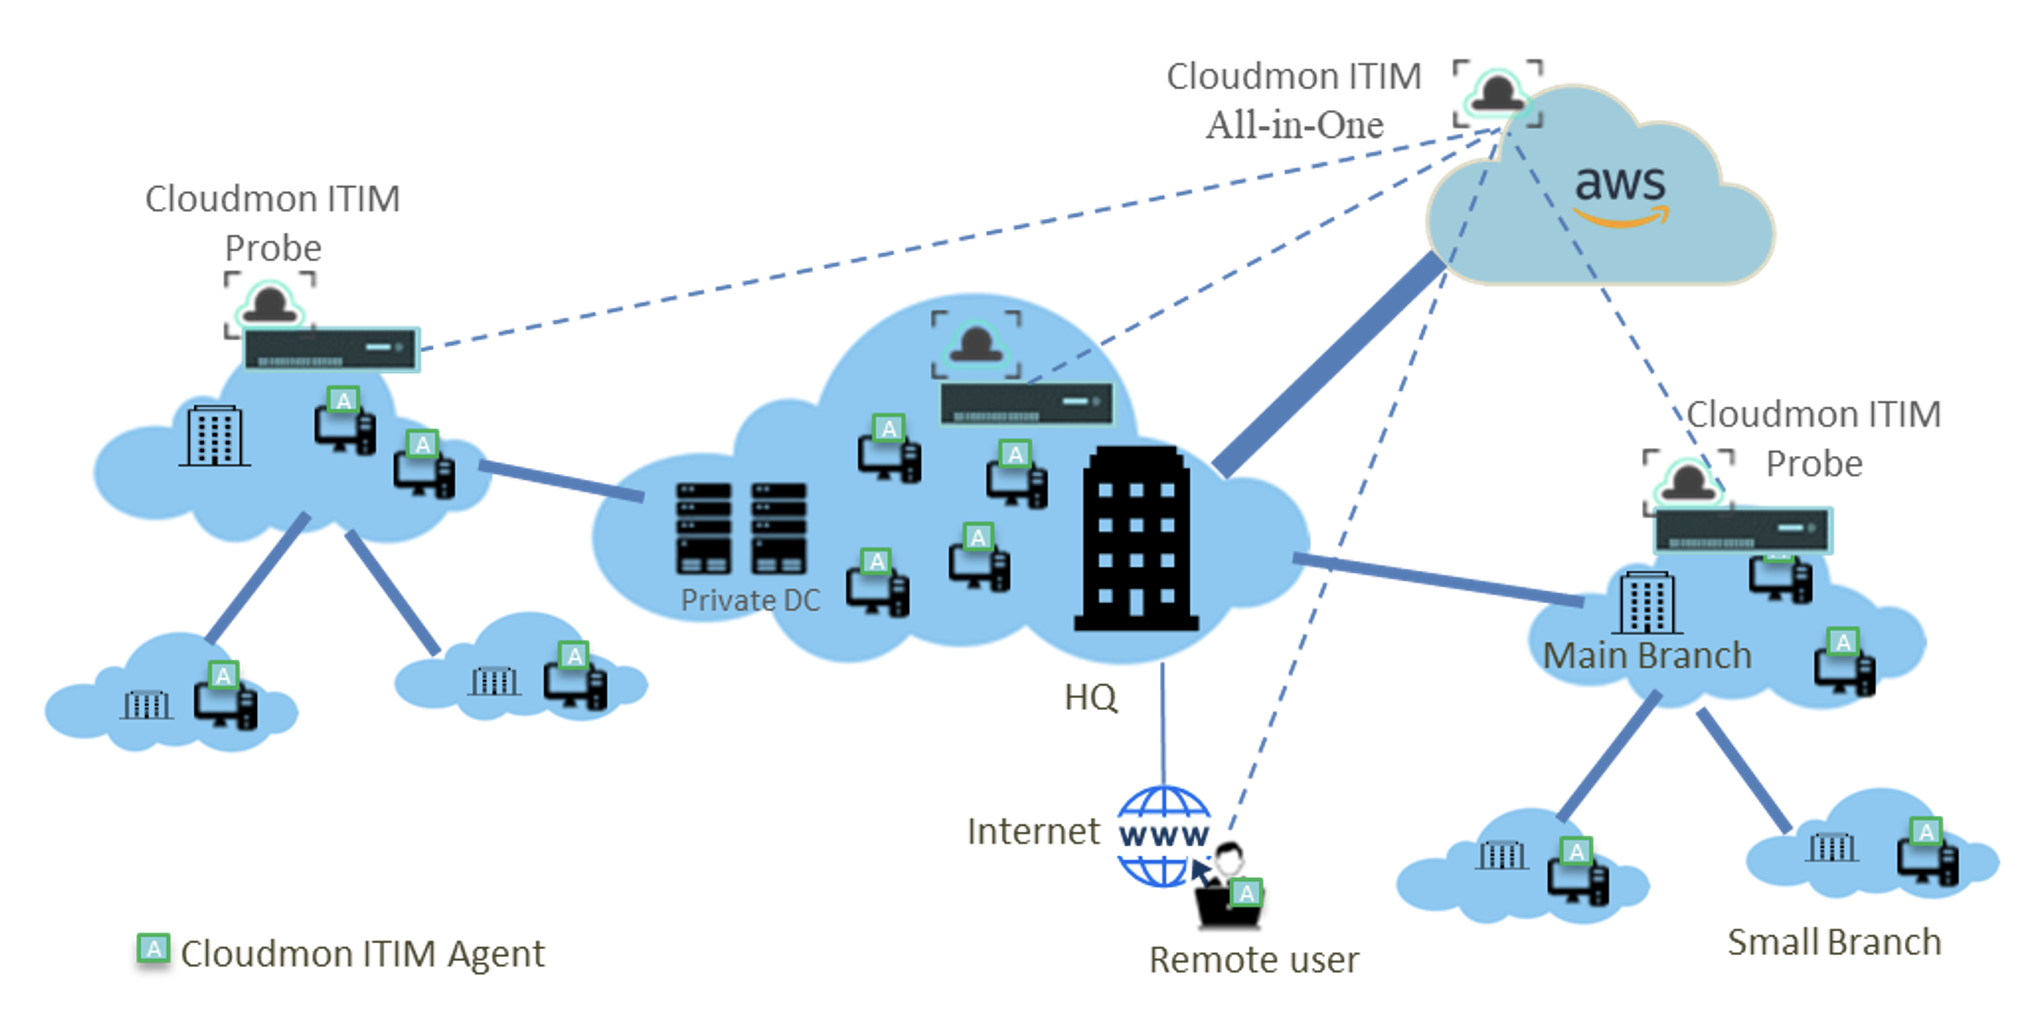
The below figure depicts a sample Cloudmon deployment showing Cloudmon Controller, Probes and Agents. Cloudmon Agents typically reside on reside on servers and hosts to provide compute and system related metrics. Cloudmon Probes are strategically located to provide network monitoring telemetry.
Getting Started
This section covers the installation procedure for the Cloudmon Probe and its configuration. The Probe can be installed on Linux Hosts or Virtual machines with one-line install option. Upon successful installation of the probe, it can be added to Cloudmon controller from the web interface, where you can analyse your monitoring and performance data.
Veryx recommends you update Cloudmon Probe with every minor and patch release, or, at a minimum, monthly. Upgrading to a major Cloudmon Probe version and keeping it updated is the only supported way to get the latest Probe functionality and fixes. The Cloudmon Probe may have frequent update releases, though, and managing updates at enterprise scale could be challenging. That doesn't mean you should wait for major releases before updating. The right update cadence for your organization depends on your infrastructure and your configuration management practices, but aim for monthly.
To update the Cloudmon Probe between two minor versions on a given host, run the corresponding install command. Cloudmon Probe release numbering follows SemVer rules.
System Requirements
Cloudmon Probe is pre-installed with Cloudmon All-in-One installation. For scalability and for the purpose of monitoring your endpoints from multiple locations, you can install, multiple probes and add it to Cloudmon controller.
We recommend that you run your Cloudmon Probe directly on Intel® i7 or equivalent hardware or in a properly configured virtual environment with CentOS 7.7
| Devices | CPU cores | RAM | Disk Space* | Additional interfaces |
|---|---|---|---|---|
| Up to 50 | 2 | 1 GB | 20GB | Not required |
| Up to 500 | 2 | 2 GB | 20GB | Dedicated DPDK supported 1G or 10G interface |
| Up to 1000 | 4 | 6 GB | 20GB | Dedicated DPDK supported 1G or 10G interface |
| >1000 | We recommend that you set up additional Cloudmon Probes contact the Veryx support team for more information on scaling. | |||
Note: * A probe system does not have any special disk requirements (< 1 GB). In general, we recommend at least 8 GB.
Installation
Probe collects data from various sources and pushes to the Controller.
Note: The probe installation does not apply for Cloudmon Basic edition. Upgrade your Cloudmon Controller to Standard or Pro edition to setup additional probes.
- Cloudmon Probe installation on Linux machine, one-step installation.
-
Run this command with elevated privileges on CentOS 7.7 server.
- This will add the Cloudmon repository for the Cloudmon Probe and install Cloudmon Probe.
- This will also automatically start the Cloudmon Probe after the installation.
- The installation log has been stored at /var/log/probeinstall.log for understanding also the error will be displayed in the STDOUT/terminal.
- Log files are located in /usr/local/cloudmon/vProbe/logs/.
- Configuration files are located in /root/Veryx/vProbe/.
Configurations
The probe automatically discovers the IP address and route information of the system and are updated in the file /root/Veryx/vProbe/setup.cfg.
General Configuration
- Login into Cloudmon Controller as Administrator.
-
Navigate to Settings>Monitoring>Probes.
-
To add your probe to the controller, click on
New, configure the probe details then save
the configuration.
Network Devices
- Login into Cloudmon Controller as Administrator.
- Navigate to Settings>Monitoring>Probes.
-
To add network devices,
- click on edit icon of the probe configured.
- navigate to Network Devices tab.
- click on New, configure the network device details then save the configuration.
IP Endpoints
- Login into Cloudmon Controller as Administrator.
-
Navigate to Settings>Monitoring>Probes.
-
To add IP Endpoints,
- click on edit icon of the
probe configured.
-
navigate to IP Endpoints tab.
-
click on New, configure the ip endpoint
details then save the configuration.
- click on edit icon of the probe configured.
- navigate to IP Endpoints tab.
- click on New, configure the ip endpoint details then save the configuration.
Metrics
The metrics collected by cloudmon-probe is given below
Network devices
| # | Metric | Description | Unit | Example |
|---|---|---|---|---|
| 1 | timestamp | Timestamp when the statistics was recorded | seconds | 1640190227 |
| 2 | uuid | Device uuid | string | ec20a4b2-093d-a2d5-f8cc-c6852433c830 |
| 3 | version | Cloudmon collector version | string | 1.7.0-2 |
| 4 | hostname | Network device name | string | cisco-switch |
| 5 | boottime | Device's last boottime | string | 1625489595 |
| 6 | ip | Device ip address | string | 192.168.10.40 |
| 7 | type | Device type | string | Switch |
| 8 | vendor | vendor | string | Cisco |
| 9 | cpu.load | CPU load average | % | 51.6 |
| 10 | mem.usage | Total memory usage | % | 41.56 |
| 11 | mem.buffcache | Memory buffcache | B | 1564131328 |
| 12 | mem.swap | Memory swap | B | 1310720 |
| 13 | fs.name | File system name | string | /dev/mapper/root |
| 14 | fs.usage | File system usage | % | 39.52 |
| 15 | iface.name | Interface name | string | enp5s5f0 |
| 16 | iface.speed | Interface current speed | bps | 1000000000 |
| 17 | iface.operstate | Operational status of the interface | string | up |
| 18 | iface.mtu | Maximum transmission unit of the interface | bytes | 1500 |
| 19 | iface.type | Type of the interface | string | wired |
| 20 | iface.tx_bytes | Number of bytes transmitted by the interface | B | 12185.74 |
| 21 | iface.rx_bytes | Number of bytes received by the interface | B | 15222.91 |
| 22 | iface.tx_bps | Number of bits transmitted by the interface per second | bps | 12085.74 |
| 23 | iface.rx_bps | Number of bits received by the interface per second | bps | 1522.91 |
| 24 | iface.tx_discards | Number of packets discarded by the transmitted interface | count | 0 |
| 25 | iface.rx_discards | Number of packets discarded by the received interface | count | 5356 |
| 26 | iface.tx_errors | Number of errors at the transmitting interface | count | 0 |
| 27 | iface.rx_errors | Number of errors at receiving interface | count | 5356 |
| 28 | iface.tx_unicast | Number of unicast packets transmitted by the interface | count | 1802.45 |
| 29 | iface.rx_unicast | Number of unicast packets received by the interface | count | 233.56 |
| 30 | iface.tx_multicast | Number of multicast packets transmitted by the interface | count | 1598.34 |
| 31 | iface.rx_multicast | Number of multicast packets received by the interface | count | 1255.77 |
| 32 | iface.tx_broadcast | Number of broadcast packets transmitted by the interface | count | 0 |
| 33 | iface.rx_broadcast | Number of broadcast packets received by the interface | count | 0 |
| 34 | process.id | ID of the process | integer | 1 |
| 35 | process.name | Name of the process | string | snmpd |
| 36 | process.path | Running path of the process | string | /usr/sbin |
| 37 | process.started | start time of the process | seconds | 1639551133 |
| 38 | process.params | Process params | string | /usr/sbin/snmpd -N |
| 39 | process.state | state of the process | string | sleeping |
| 40 | process.cpu | CPU utilized by the process | % | 3.4 |
| 41 | process.mem | Memory utilized by the process | % | 15.66 |
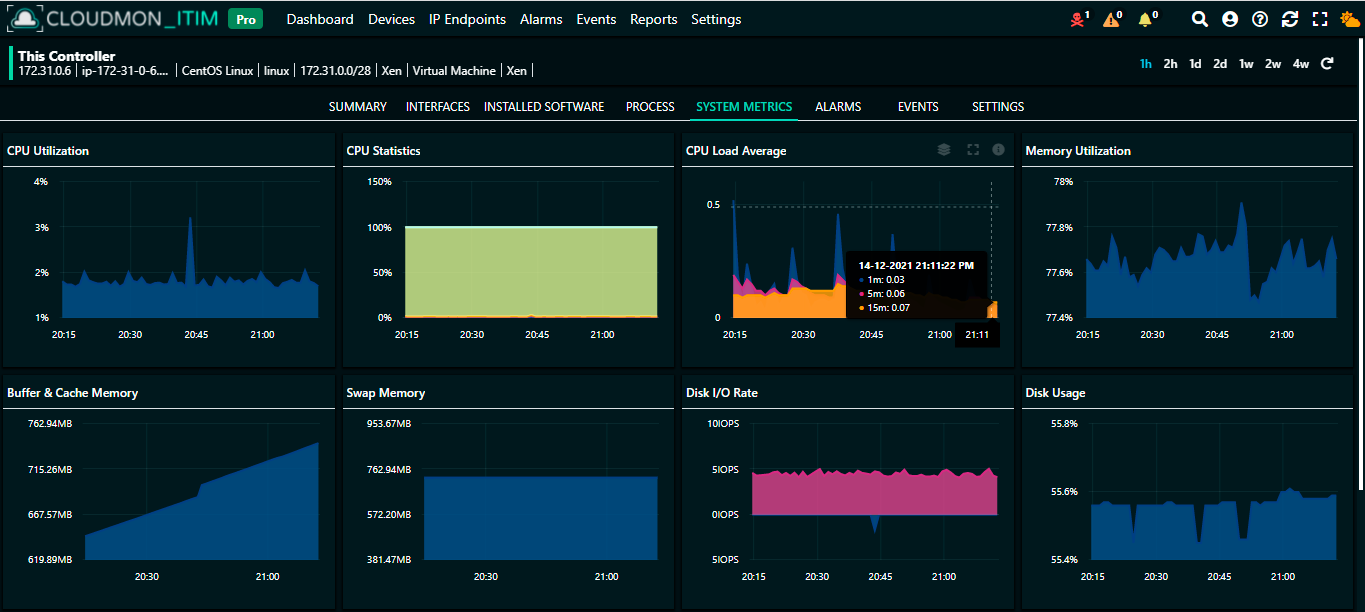
Hosts & Servers
| # | Metric | Description | Unit | Example |
|---|---|---|---|---|
| 1 | timestamp | Timestamp when the statistics was recorded | seconds | 1640190227 |
| 2 | uuid | Device uuid | string | ec20a4b2-093d-a2d5-f8cc-c6852433c830 |
| 3 | version | Cloudmon Probe version | string | 1.7.0-2 |
| 4 | hostname | Device name | string | localhost.localdomain |
| 5 | boottime | Device's last boottime | string | 1625489595 |
| 6 | location | Device location | string | Mumbai, Maharashtra, India |
| 7 | ip | Device ip address | string | 10.1.4.229 |
| 8 | type | Device type | string | Virtual Machine |
| 9 | network | Network ip address | string | 10.1.4.0/24 |
| 10 | mon_type | Device monitoring type | string | agent |
| 11 | vendor | vendor | string | Xen |
| 12 | system.model | system model | string | HVM domU |
| 13 | system.version | system version | string | 4.2.amazon |
| 14 | system.serial | system serial number | string | ec20a4b2-093d-a2d5-f8cc-c6852433c830 |
| 15 | os.arch | Operating system processor | string | x86 |
| 16 | os.codename | Name of operating system, while it's in development | string | core |
| 17 | os.kernel | Kernel is the central component of an os manages operations of system and hardware | string | 3.10.0-1062.12.1.el7.x86_64 |
| 18 | os.distro | Distribution of operating system | string | Windows 10 Pro Edition |
| 19 | os.platform | Platform of operating system | string | linux |
| 20 | os.release | OS version | string | 7.6 |
| 21 | cpu.load | CPU load average | % | 51.6 |
| 22 | cpu.user | Time spent in running un-niced user processes | % | 37.98 |
| 23 | cpu.sys | Time spent in running kernel processes | % | 13.64 |
| 24 | cpu.nice | Time spent in running niced user processes | % | 0 |
| 25 | cpu.idle | Time spent in the kernel idle handler | % | 48.39 |
| 26 | cpu.irq | CPU interrupts | % | 0.01 |
| 27 | cpu.temp | CPU temperature | % | 30 |
| 28 | mem.usage | Total memory usage | % | 41.56 |
| 29 | mem.buffcache | Memory buffcache | B | 1564131328 |
| 30 | mem.swap | Memory swap | B | 1310720 |
| 31 | fs.name | File system name | string | /dev/mapper/centos-root |
| 32 | fs.usage | File system usage | % | 39.52 |
| 33 | fs.rbps | Rate at which filesystem read operation is done | bps | 13540.23 |
| 34 | fs.wpbs | Rate at which filesystem write operation is done | bps | 115540.69 |
| 35 | disk.rops | Number of disk read requests per second | Requests per sec | 3.12 |
| 36 | disk.wops | Number of disk write requests per second | Requests per sec | 5.23 |
| 37 | iface.name | Interface name | string | enp5s5f0 |
| 38 | iface.speed | Interface current speed | bps | 1000000000 |
| 39 | iface.operstate | Operational status of the interface | string | up |
| 40 | iface.tx_bps | Number of bits transmitted by the interface per second | bps | 12085.74 |
| 41 | iface.rx_bps | Number of bits received by the interface per second | bps | 1522.91 |
| 42 | iface.tx_discards | Number of packets discarded by the transmitted interface | string | 0 |
| 43 | iface.rx_discards | Number of packets discarded by the received interface | string | 5356 |
| 44 | iface.tx_errors | Number of errors at the transmitting interface | string | 0 |
| 45 | iface.rx_errors | Number of errors at receiving interface | string | 5356 |
| 46 | process.id | Id of the process | string | 1 |
| 47 | process.name | Name of the process | string | mongod |
| 48 | process.ppid | Parent id of the process | string | 8932 |
| 49 | process.path | Running path of the process | string | /usr/bin |
| 50 | process.started | start time of the process | seconds | 1639551133 |
| 51 | process.params | Process params | string | -f /etc/mongod.conf |
| 52 | process.command | Command of the process | string | mongod |
| 53 | process.state | state of the process | string | sleeping |
| 54 | process.cpu | CPU utilized by the process | % | 3.4 |
| 55 | process.mem | Memory utilized by the process | % | 15.66 |
| 56 | properties.location | Type of virtual host | string | Veryx Lab |
Performance monitoring metrics:
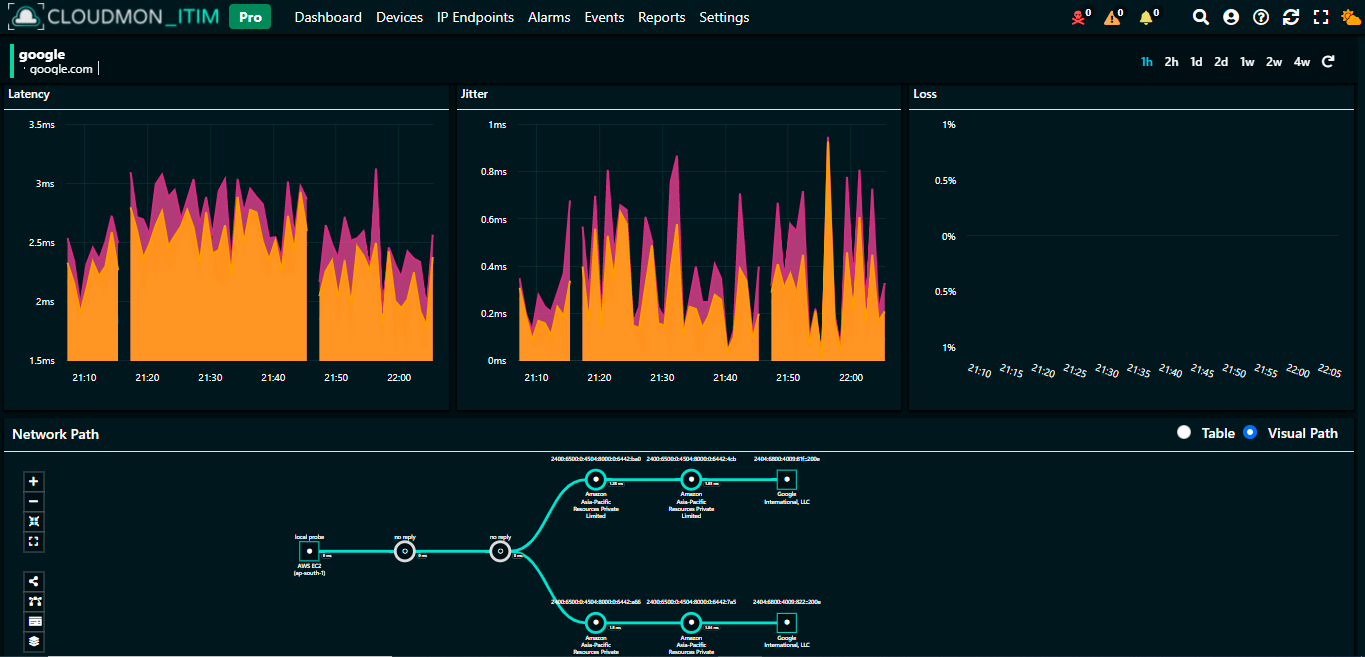
IP Endpoints
Probe is the agent for availability monitoring. It actively monitoring for network link availability statistics of Ip endpoint and pushes them to Cloudmon Collector. Probe uses ICMP for active monitoring of network link availability. The default minimum monitoring interval supported by Probe is 5 mins.
Probe collects the following metrics
| # | Metric | Description | Unit | Example |
|---|---|---|---|---|
| 1 | timestamp | Timestamp when the statistics was recorded | seconds | 1640190227 |
| 2 | mon_id | Monitoring ID for monitoring the asset link | string | 1 |
| 3 | latency | Latency faced by the asset link | ms | 124.29 |
| 4 | jitter | Jitter faced by the asset link | ms | 3.2 |
| 5 | loss | Loss faced by the asset link | % | 0 |
Availability monitoring metrics:
FAQ
To access the frequently asked questions, please click on the following link FAQChangelog
See what's new added, changed, fixed, improved or updated in the latest versions.
Version 1.7 (1 Jan, 2022)
- Added Auto upgrade support
- Added Support for IPv6 Endpoints
- Added Support for using TCP packets for latency measurement and netpath
Version 1.6(6 Jul, 2021)
- Added Support to fetch apps and processes for servers
- Updated Updated additional process information
Version 1.4 (20 May, 2021)
- Added min/max/avg values added for latency and jitter
- Fixed Failed to fetch node data when v1 and v2 credentials are swapped
- Fixed Incorrect category for network devices using snmp
- Fixed Do not show cpu as 0 for unsupported vendors
Version 1.2 (28 Apr, 2021)
- AddedSupport for software upgrade
- Fixed Few missing datapoints of availability statistics
- Updated Improved error messages in log
Version 1.1 (22 Mar, 2021)
- Added Monitoring specific metrics
- Added Errored status added for snap device
- Added High frequency polling added
- Fixed Host ip of snap device is always undefined
- Fixed Handle error when no default gateway is configured
- Updated Validate and sanitinize request
Version 1.0 (3 Mar, 2021)
Initial Release